|
|
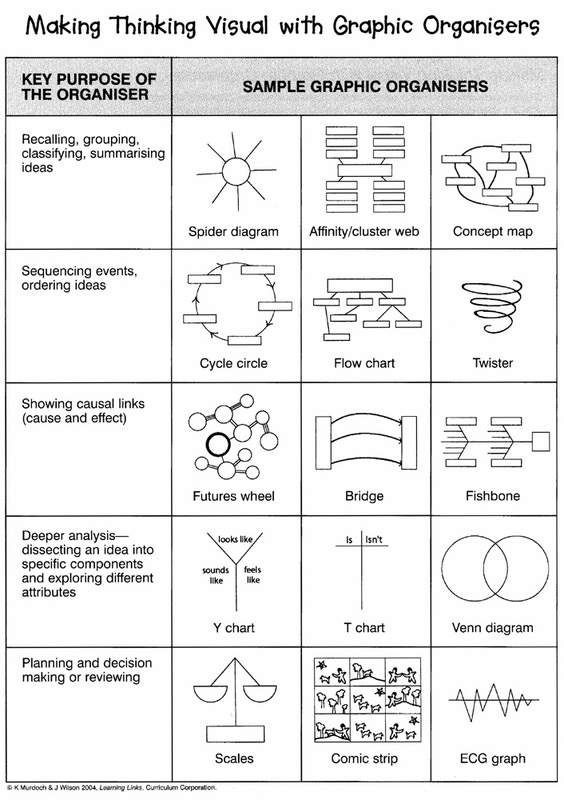
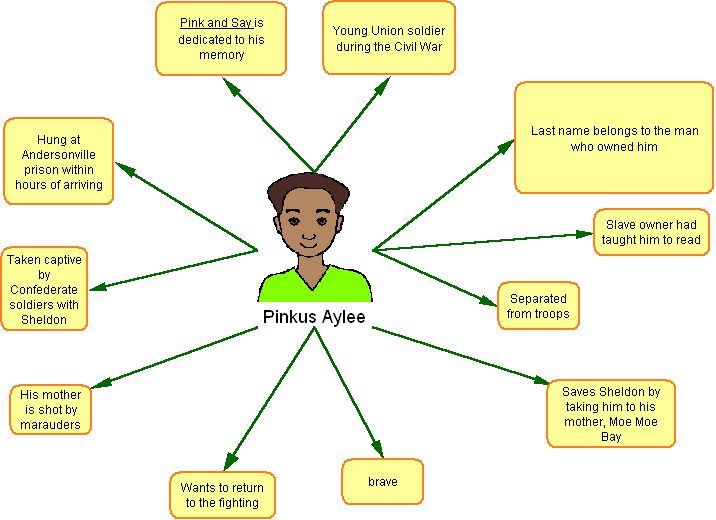
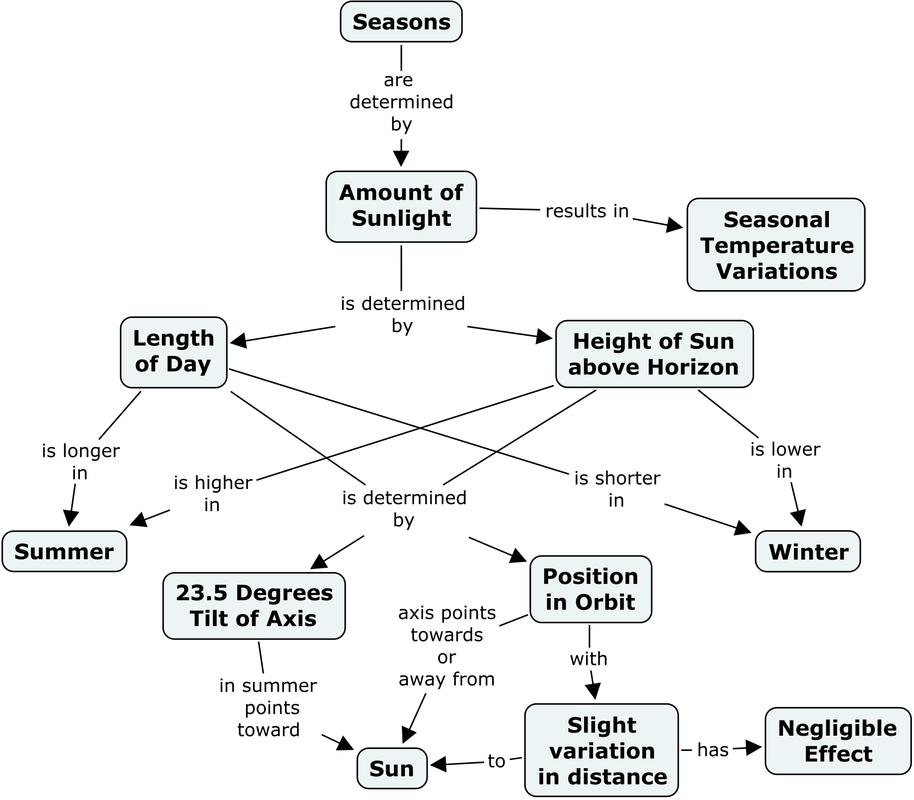
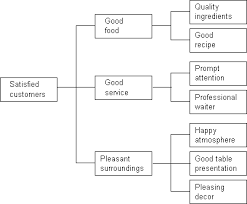
Concept Maps:
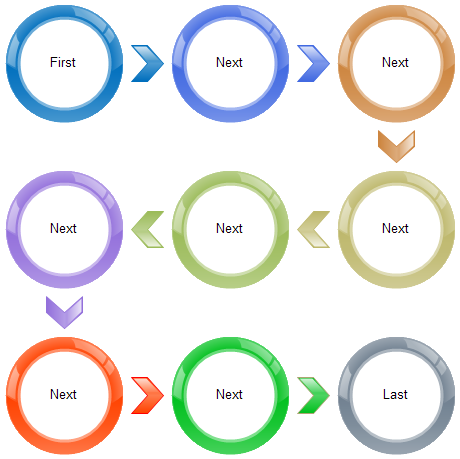
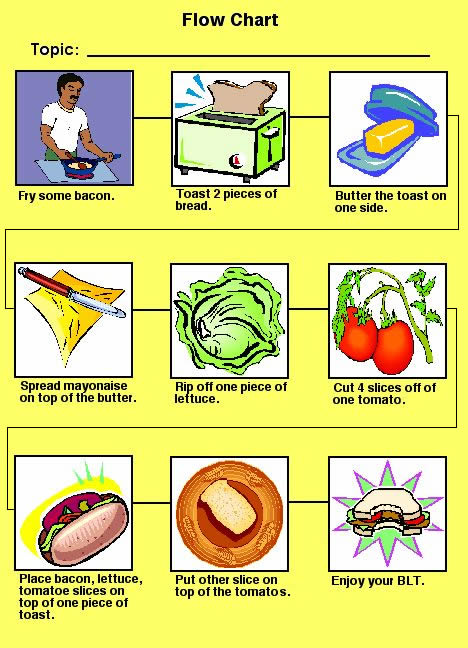
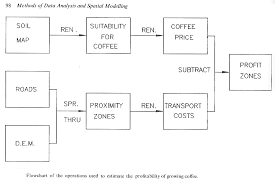
Flow Diagram:
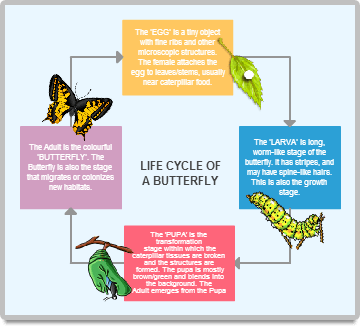
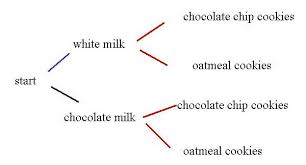
Tree diagram:
|


|
|
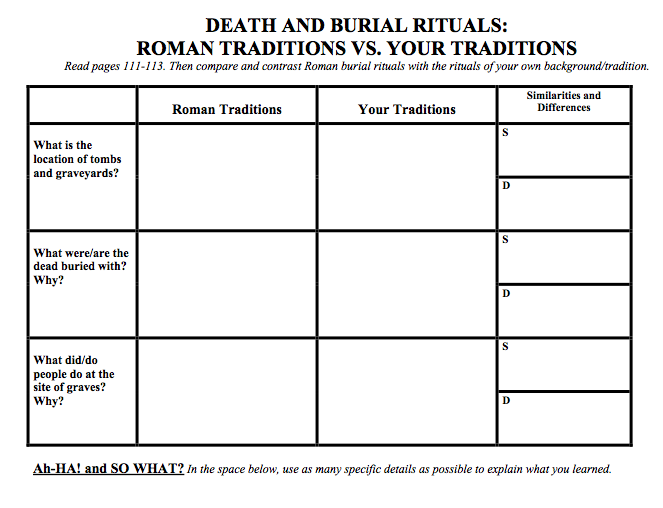
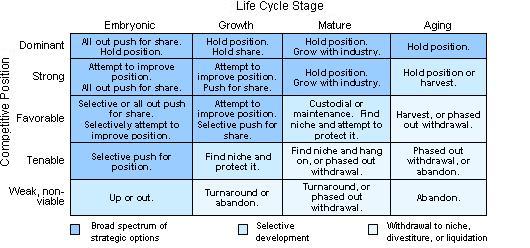
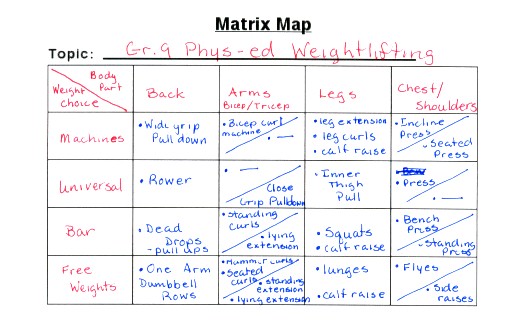
Matrices:
|
| Fisher, D., & Frey, N. (2012). Improving adolescent literacy: Content area strategies at work (3rd ed., pp. 101-120). Boston: Pearson. |
|
|
Concept Maps:
Flow Diagram:
Tree diagram:
|
|
|
Matrices:
|